
In this article, we explore how driver-based forecasting differs from consolidation, why it enables more meaningful...

From Seats to Credits: Forecasting Credit-Based Revenue
August 13, 2026

We all pay a flat monthly fee for Netflix, Spotify, and Prime. Same bill every month, whether we binge-watch everything or barely log in. Software pricing used to work the same way.
That is changing fast. 2025 was the year many companies stopped charging per seat and started charging per use. API calls. Compute hours. AI tokens. Credits. Figma did it. HubSpot did it. Salesforce did it. The Metronome State of Usage-Based Pricing report pegged the number at 77% of large software companies now running some form of consumption pricing. And Kyle Poyar's research on the PricingSaaS 500 showed credit models specifically jumped 126% last year. Pure subscription? Down from 65% to 43% since 2023.
Customers tend to like this. You only pay for what you use; the starting price is lower, and it scales with your actual needs. Finance teams, on the other hand, have a real problem on their hands. And I don't think enough of us are talking about it openly.
The Forecasting Problem Nobody Warned About
Annual contracts and seat-based pricing made forecasting relatively mechanical. Count seats. Apply your renewal rate assumptions. Layer in the pipeline. You'd get within a reasonable range.
Consumption-based revenue works differently, and the formula tells you why: Revenue = Customers x Consumption x Price. That consumption variable in the middle? It is where every forecast I've seen starts to come apart.
Here's what makes it so hard. A customer might ramp up aggressively right after onboarding, then flatten once they figure out what they actually need. Q1 almost always dips because new budgets bring new scrutiny. Then usage might spike in Q3 because someone on their team discovered a feature they weren't using before. None of that follows a straight line. And if you're building your forecast off historical averages, you're blending all of those patterns into one number that misrepresents every single one of them.
Snowflake's filings put a number on this dynamic. NRR: 178% in FY2022. Down to 126% by FY2025. Not because the product got worse. Enterprise customers just had the freedom to spend less when budgets tightened, and a lot of them took it. The same pricing structure that powered a huge expansion in good years made contraction just as easy when the economy cooled. Standard SaaS metrics weren't built to pull apart those two stories.
The Metrics That FP&A Teams Are Missing
Our entire metric toolkit was built for a world where revenue was ratable and predictable over the contract term. ARR. MRR. NDR. Gross margin. Churn. Every single one of those numbers assumes stability within the billing period.
When you add consumption to the mix, that assumption breaks. And for teams operating in hybrid pricing (which, let's be honest, is increasingly everyone), I think we need to rethink the metrics at two layers.
Layer 1: Adapt what you already track
ARR is typically split into Committed ARR and Consumption ARR. Committed ARR includes platform fees and contractual minimums, while Consumption ARR captures the variable usage-based revenue and trailing credit, annualised.
Layer 2: Track what didn’t exist before
Credit burn rate is the one I keep coming back to. It measures how many credits a customer goes through per day or per week. The reason it matters: it moves before your revenue line does. If burn is accelerating, that customer is heading toward an overage or a plan upgrade. If it's slowing down, something changed. Your CS team should hear about it before the next QBR, not after.
Credit utilisation is consumed versus allocated. A simple concept, but it tells you something important: are customers actually getting value from what they bought? If an account is sitting at 40% utilisation three months in, that's not a healthy sign.
And then there's days of credit exhaustion. Take the remaining balance and divide by the daily burn. When it drops below 20, someone should have a conversation about a top-up or an upgrade. In the subscription world, renewal dates gave you a built-in trigger for those conversations. With credits, this metric is the replacement.
Revenue Recognition Under ASC 606
Under ASC 606, when a customer prepays for credits, that cash cannot be recognised as revenue until the credits are consumed. The prepayment sits on the balance sheet as deferred revenue. This means it depends on how fast the customers use their credits, not on the calendar.
This is very different from subscription revenue recognition, where deferred revenue declines on a fixed schedule. You know what each month looks like before it starts, whereas with credits, that visibility disappears, making it harder to forecast. There are a few specific complications worth flagging.
First, breakage: you need to estimate what portion of credits will expire unused. If historical data shows a consistent pattern, ASC 606 lets you recognise that expected breakage proportionally as other credits are redeemed, rather than waiting for expiration.
Second, mid-cycle top-ups have to be treated as contract modifications, which triggers a reallocation of the transaction price.
Third, if the contract includes volume discounts or tiered rates, you are dealing with variable consideration that needs to be constrained.
Variance Analysis Needs More Dimensions
In a subscription business, when the revenue misses the forecast, the variance is usually driven by a small number of predictable drivers. If actuals miss the forecast, the root cause is typically higher churn, lower new ARR, or weaker expansion. The Net Dollar Retention bridge provides a structured, clean way to isolate the drivers and quantify their impact.
Credit-based revenue blows the predictable world of subscription variance analysis. Instead of analysing a miss through two or three stable drivers, you now have four independent axes to decompose:
Volume: Did fewer customers purchase additional credit packs than expected?
Intensity: Did customers consume fewer credits per period than your model assumed?
Price: Did effective credit pricing shift because of discounts, repricing, or promotional packs?
Mix: Did your customer base tilt toward lower-consuming segments or use cases?
A spreadsheet won't tell you why consumption slowed, which is why I find the intensity dimension very tricky. We would need product-level usage data to understand what actually drives the usage behaviour. And that’s the real adjustment for FP&A in hybrid pricing models: You can’t build a credible consumption forecast by looking only at last quarter’s numbers. You need to know why customers use more or less. Why did usage spike in March? Was it a feature launch? A seasonal campaign? One enterprise customer running a massive batch job? These are product and customer success questions, not traditional finance questions. But the forecast won’t be right unless someone in finance is asking them.
What FP&A Must Change in Practice
Forecasting Cadence: Quarterly forecasting cycles are well-suited for Annual Contract and subscription models that barely move within updates. For consumption revenue, I suggest monthly reforecasting of the variable part and a weekly pulse check on credit burn rates for the top 20 accounts. Those accounts will drive most of the variance anyway. The committed piece (platform fees, contract minimums) can stay on a quarterly cycle. Treat them as two separate forecasts that roll up to a single number.
Business Partnering: This is the biggest shift for FP&A. Earlier, the counterparts were Sales (for pipeline and bookings data) and sometimes HR (for headcount planning). The new model pulls in four additional partners-
Product: They control the roadmap. If a new feature launching in Q3 could double credit burn for part of the customer base, it will directly shift the forecast. FP&A should be involved in all those conversations to anticipate the impact.
RevOps: Revenue Operations owns billing rules, credit multipliers, and pricing tiers. Any change flows directly into consumption revenue. At a minimum, FP&A needs a shared change log.
Customer Success: CS sees adoption trends first. They know which accounts are ramping, stalling, or optimising down. That insight should feed forecast assumptions.
Accounting: Breakage, contract modifications, and variable consideration make rev rec complex. FP&A and Accounting must stay aligned on utilisation and breakage assumptions.
Reporting: Board decks should show Committed ARR and Consumption ARR on separate lines. Leadership needs to see how much of the revenue base is stable versus how much is tied to customer behaviour. I'd also add a credit health summary to the monthly review: average utilisation across the base, number of accounts above 100% (expansion signal), number below 50% (churn risk), and the month-over-month shift in overall burn rate. It gives leadership a forward-looking perspective and keeps the team proactive rather than reactive.
The comparison below maps seven dimensions where subscription and credit-based models diverge:
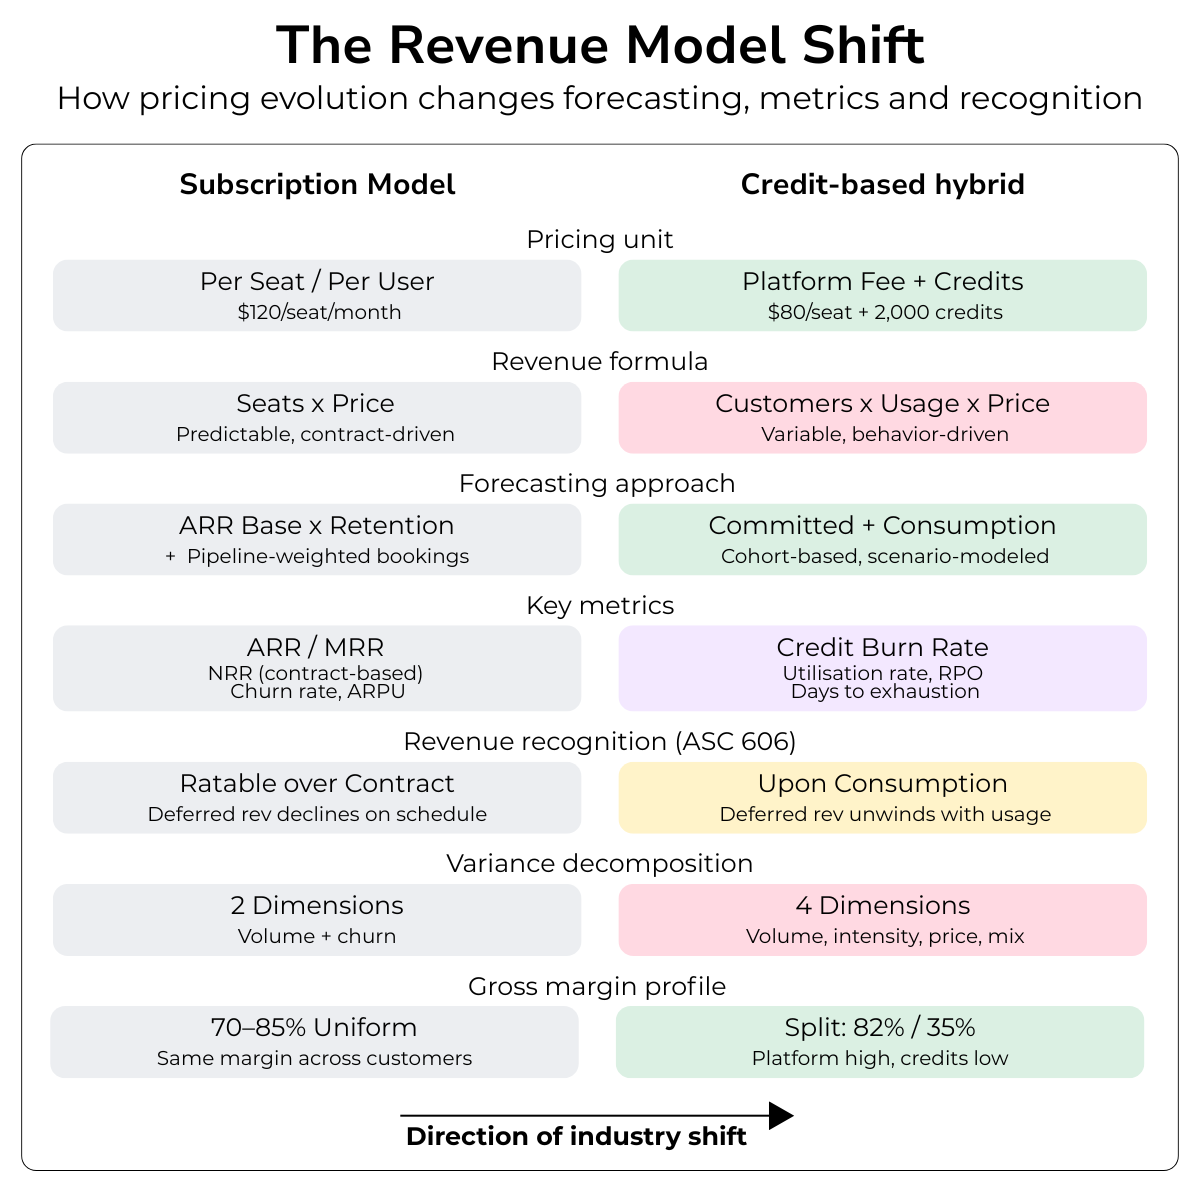
Figure 1. How the Shift to Credit-Based Revenue Changes FP&A Forecasting
What FP&A Should Do Next
FP&A teams do not need to rebuild their entire revenue model at once. But they do need to start separating what is contractually committed from what depends on customer behaviour.
Three simple steps to get ahead of most FP&A teams in SaaS today:
Split ARR into committed and consumption.
Collaborate with product teams to obtain product usage data, even if it's messy!
Partner closely with Customer Success and product teams to understand the drivers behind customer usage.
For companies moving toward credit-based or consumption revenue, the FP&A forecast can no longer rely mainly on contracts, renewals, and pipeline. It also needs to reflect customer behaviour, product usage, pricing mechanics, and revenue recognition assumptions.
That is a different forecasting discipline. Finance teams that understand this shift early will be better placed to explain not only where revenue is coming from, but also where growth, risk, and customer value are starting to emerge.
References
- Metronome. "State of Usage-Based Pricing 2025." https://metronome.com/state-of-usage-based-pricing-2025
- Poyar, K. "What Actually Works in SaaS Pricing Right Now." Growth Unhinged, February 2026. https://www.growthunhinged.com/p/2025-state-of-saas-pricing-changes
- Snowflake Inc. Form 10-K, Fiscal Year 2025. SEC Filing. https://www.sec.gov/Archives/edgar/data/0001640147/000164014725000052/snow-20250131.htm
- Murray, B. "Top Financial Metrics Tracked by Usage-Based Companies." The SaaS CFO, August 2025. https://www.thesaascfo.com/top-financial-metrics-tracked-by-usage-based-companies/
- Murray, B. "AI ARR vs. SaaS ARR: How to Define and Calculate." The SaaS CFO, June 2025. https://www.thesaascfo.com/ai-arr-vs-saas-arr-how-to-define-and-calculate/
- KPMG. "Handbook: Revenue for Software and SaaS." December 2025 Edition. https://kpmg.com/us/en/frv/reference-library/2025/handbook-revenue-software-saas.html
- Clay. "The Thinking Behind Our New Pricing: Our Internal Memo." March 2026. https://www.clay.com/blog/clay-pricing-memo-internal
- Metronome. "AI Pricing and Billing Playbook: The OpenAI Case Study." https://metronome.com/blog/ai-pricing-and-billing-playbook-the-openai-case-study
- Poyar, K. "The State of B2B Monetization in 2025." Growth Unhinged, June 2025. https://www.growthunhinged.com/p/2025-state-of-b2b-monetization
- Getmonetizely. "SaaS Pricing Benchmark Study 2025." https://www.getmonetizely.com/articles/saas-pricing-benchmark-study-2025-insights-from-100-companies
The full text is available for registered users. Please register to view the rest of the article.
Related articles
Driver-Based Forecasting in FP&A: Common Pitfalls and Practical Solutions

How AI cost dynamics force FP&A to move from forecasting to decision-ready planning.

In this article, forecasting frequency is examined through the lens of data maturity, leadership behaviour, and...

Among FP&A challenges understanding, explaining and forecasting revenues evolutions are one of the top items. It...

When creating a driver-based model, it is important to produce one that is not overly detailed...

In this article, the author explains how FP&A teams can impact pricing strategies for companies to...
+
Subscribe to
FP&A Trends Digest

We will regularly update you on the latest trends and developments in FP&A. Take the opportunity to have articles written by finance thought leaders delivered directly to your inbox; watch compelling webinars; connect with like-minded professionals; and become a part of our global community.