
In this article, the author compares data visualisation to healthy nutrition, underscoring the importance of the...

From Data to Dialogue: Elevating FP&A Storytelling with Waterfall Charts
January 8, 2026
 Our brains are naturally wired to make sense of the world, constantly creating narratives from the information we receive. When different individuals process the same data, they often come to very different conclusions. This is why one of the most common challenges in the FP&A function is effectively communicating insights. While FP&A teams are often known for working with complex financial data and models, our real power lies in transforming these numbers into clear, compelling stories that resonate with stakeholders.
Despite all the advanced technology available today, many FP&A teams still struggle with developing and leveraging storytelling during meetings and presentations. That should not come as a surprise, considering that most FP&A job descriptions do not even list storytelling as a desired skill during hiring. Some believe that the ability to translate numbers into stories is innate or a personality trait. But I strongly believe that storytelling is a skill that can be learned and developed.
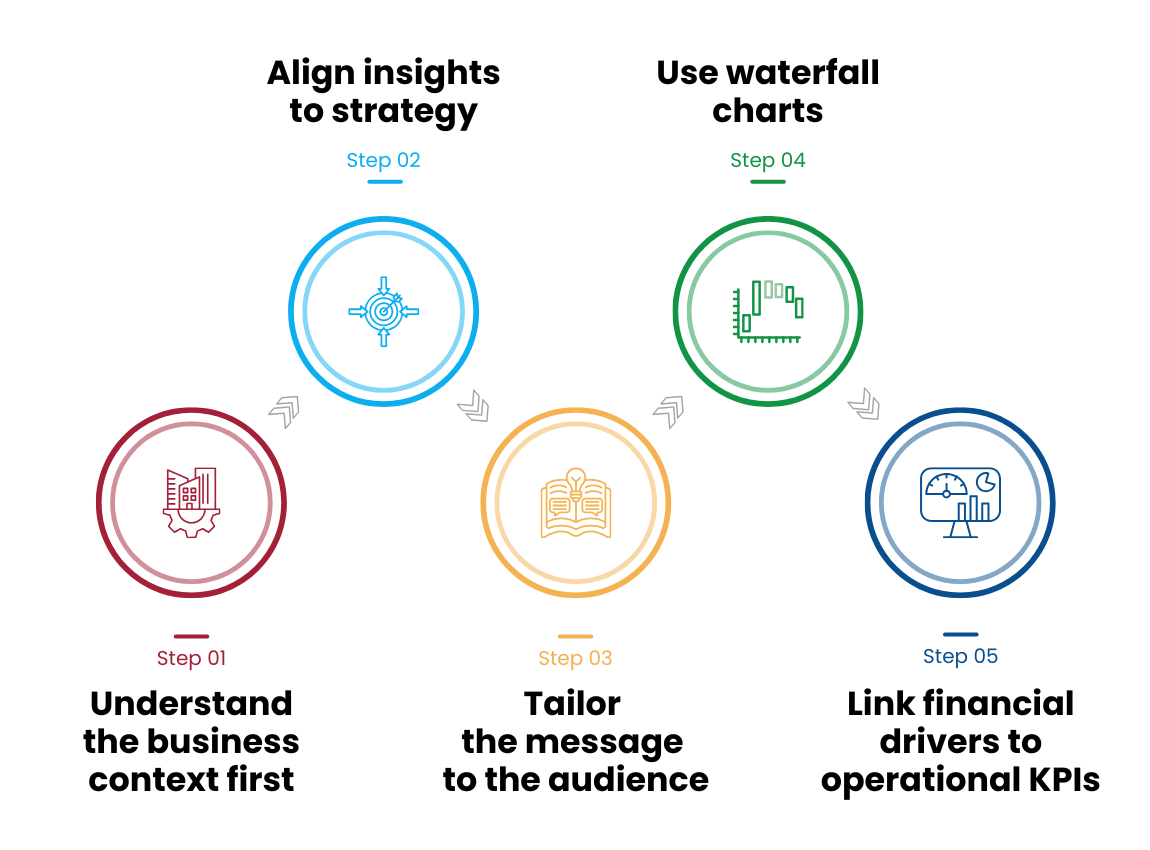
With over 20 years of experience in FP&A, I can confidently say that the key to telling stories using numbers lies in a deep understanding of the business context. Building this understanding involves forging strong relationships with stakeholders who influence the financial numbers — an effort that requires time, commitment, and clear support from leadership.
The FP&A function must be involved in every strategic conversation and have access to the main drivers of revenue, costs, and expenses, as well as the processes that support these metrics. Creating a data-driven culture is essential for this involvement. Without a thorough understanding of the numbers, knowing why, when, and how balances, variances, and KPIs are created, it is impossible to craft meaningful stories.
The next step is to align insights with the organisation’s strategic goals. Insights are only valuable if they lead to action, whether that’s continuing successful initiatives or making necessary adjustments. When presenting insights, it’s critical to establish objectives and clearly articulate actionable next steps. This approach encourages shared responsibility among stakeholders and supports collective progress toward financial and strategic targets.
Once the FP&A team has access to the right data, understands its context, and aligns insights with strategic priorities, the focus should shift to the audience. Different stakeholders have different needs, so it’s important to tailor KPIs and figures into engaging narratives that foster understanding and drive action. Special care should be taken when preparing presentations for non-financial audiences, particularly regarding the choice of tools and formats.
This is where waterfall charts shine. They are simple yet powerful tools that help visualise financial outcomes, especially variances from budget, in a way that’s clear, visual, and easy to understand. By turning numbers into stories, we can help non-financial leaders grasp not just how the company is performing, but also how their actions directly impact results.
I particularly enjoy using waterfall charts when presenting profitability margin variances against the budget to operational leaders.
These managers are experts at running the day-to-day aspects of the business, but they often find financial statements and presentations overwhelming. By breaking down the impact step-by-step — highlighting the key drivers that have positively or negatively affected margins, and linking these financial factors to operational metrics, they can easily understand how their actions influence the company’s financial results. For example, at Amerit Fleet Solutions, where we provide maintenance and repair services, I connect revenue variances to specific operational variables such as overtime hours worked, the percentage of hours billed versus hours paid per employee, and billing rates compared to forecasted rates at each location. This approach helps make complex financial data more relatable and actionable for the team.
Here are some useful tips for creating effective waterfall charts:
Keep the chart simple: Limit to six or seven steps to clearly explain the main variances, focusing on the most significant and strategic ones.
Break down the components: Organise variances into logical categories such as revenue, costs, and expenses that contribute to the overall change.
Share in advance: Distribute the charts at least 48 hours before meetings, allowing managers sufficient time to review, reflect, and come prepared for meaningful discussion.
Using this approach enhances understanding of financial performance and creates opportunities for cross-functional listening and collaboration. It encourages a culture of problem-solving, whether that means improving tools, streamlining processes, or offering targeted support, helping teams get back on track more effectively.
Waterfall charts are an affordable and accessible tool that can serve as a practical guide for developing storytelling skills, using numbers and operational KPIs, step-by-step. To do this effectively, you need to understand what drives the numbers and how they’re influenced. When you present a concise, visual story, it opens the door for meaningful discussions on next steps and shows how the FP&A team can best support the business.
By leveraging simple storytelling tools like the waterfall chart, FP&A can become more than just data crunchers; they can be the voice behind the numbers. This helps eliminate distractions, drive impactful outcomes, support faster decision-making, and most importantly, position FP&A as a strategic partner within the organisation.
The full text is available for registered users. Please register to view the rest of the article.
Related articles

In this article, we will dive into the ‘Why’, the ‘What’, and the ‘How’, culminating in...

In this article, the author shares the essentials of compelling data storytelling and provides several tips...

Data storytelling is a growing trend that is picking pace with each passing day. In his...

FP&A Data Visualisation: Showcase Your Critical Thinking Skills!
You will be considered a great FP&A professional only if you can communicate clearly, effectively, and...

In this article, the author discusses the key aspects of FP&A storytelling, highlighting the importance of...
+
Subscribe to
FP&A Trends Digest
We will regularly update you on the latest trends and developments in FP&A. Take the opportunity to have articles written by finance thought leaders delivered directly to your inbox; watch compelling webinars; connect with like-minded professionals; and become a part of our global community.