
A strong data strategy is crucial for FP&A teams to ensure accurate, timely and meaningful insights...

Continuous Monitoring: The Power of Key Performance Indicators, Repetition and Frameworks
November 27, 2025

In Part I, we learned how focusing on marginal revenue and compensation can help evaluate business performance. In Part II, we examined how segmenting revenue and expenses and evaluating performance over longer time periods can help unlock hidden levers in the P&L. Now, in Part III, we will discuss how FP&A can use these tools to help keep focus throughout the year.
Forward-Looking Data Supported Decisions vs. Data-Driven Decisions
In today’s environment, there’s a strong bias toward running analytics and letting the data “tell us what to do.” But decision-making isn’t that simple. Looking forward is never as clear as looking back, and even with robust data, judgment plays a critical role, as no one knows the future. In addition to that, the reality of imperfect data quality and the ability to get different answers by changing time frames make it clear that FP&A’s role isn’t just to drive decisions with data but to support decisions with balanced evidence.
That means presenting both sides of a position — frequently playing the devil’s advocate role. Data can be used to support two sides of any argument and we need to be able to see both sides. Our leaders should never be blindsided because we presented data to help cover up blemishes instead of helping them understand the tradeoffs that must be assessed in every decision. FP&A builds credibility and helps leaders make informed, confident choices by showing both the pros and cons.
The Power of Repetition
One of the most powerful tools for shaping mental models is repetition. When business leaders consistently engage with their key metrics, they begin to internalise performance drivers and notice the subtle changes that matter. The monthly review of consistent metrics — annualised for rolling 12-month performance and a focus on marginal gain or decline is key. This keeps the conversation focused on strategy and actions rather than just understanding complicated accounting numbers.
Sometimes, it may feel like once leaders have mastered the data, they no longer need FP&A. But the opposite is true. As their fluency grows, so does their appetite for deeper insight. They explore new angles, including different segmentations, alternative views, or trend overlays that reveal previously hidden value. FP&A’s role is to evolve alongside them, continuously reframing the data to unlock new perspectives and support better decisions.
The Monthly Review – Focus on Changing Trends
As we bring these concepts into our monthly financial statement review, it’s important to stay focused. While most companies review the P&L monthly, these reviews often get clouded by noise — timing variances, allocation shifts, and one-time items that obscure the real story.
It takes effort to sift through that noise, but the goal isn’t to showcase how FP&A cleaned up the data. The goal is to tell a story about the fundamentals, the key business drivers that persist regardless of accounting volatility. The key is to keep the focus on full-year metrics.
Let’s assume that through June, our year is progressing exactly as we want it to progress. We are in Quadrant 1 in our Growth and Profitability matrix, with revenue growth at 10% and comparable store growth at 8%. We expect to maintain this performance for the full year. Here’s what we might see in our June financial review.
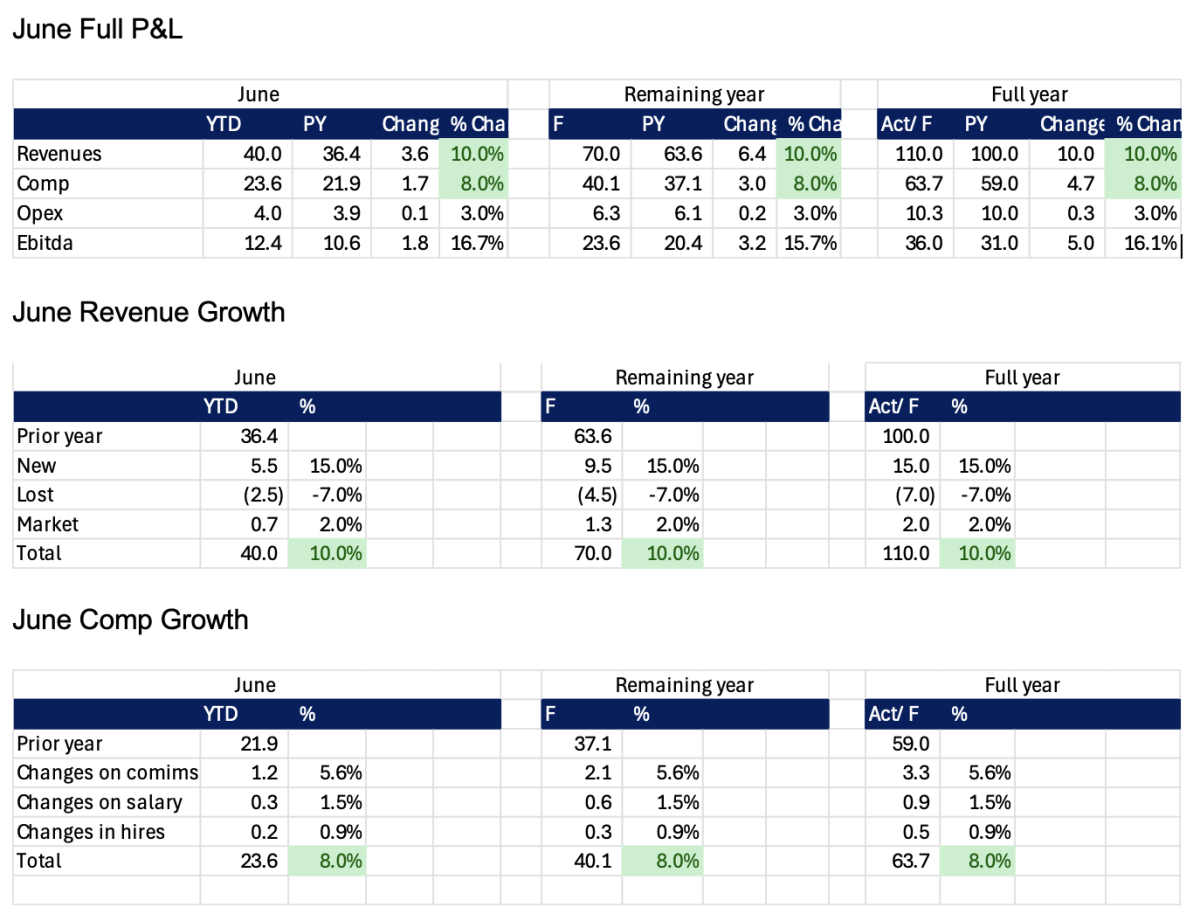
Figure 1. Monthly Review Example: From Sweet Spot to Margin Squeeze
In July, we encountered a few bumps in the road and made some forecast changes. We don’t anticipate as much new business as we initially thought, and we have lost a couple of accounts. We also had to give a few more raises than we thought, and extend some contracts that we thought were coming to term. After all these changes, we still expect a strong P&L, but we need to communicate that we’re moving from
- Quadrant 1 (Where Marginal revenue is greater than Marginal Cost) into
- Quadrant 2 (Where Marginal Cost is higher than Marginal Revenue).
If we can add colour to identify which segments (Segment A, Segment B, or Segment C) drive the changes, and which employee class (stars, role players, or developing) — that’s additional insight that can help us determine necessary adjustments. See numbers below. As we review the numbers, it’s also important to provide confidence intervals in the forecast and key assumptions for factors such as known and unknown new business and lost business.
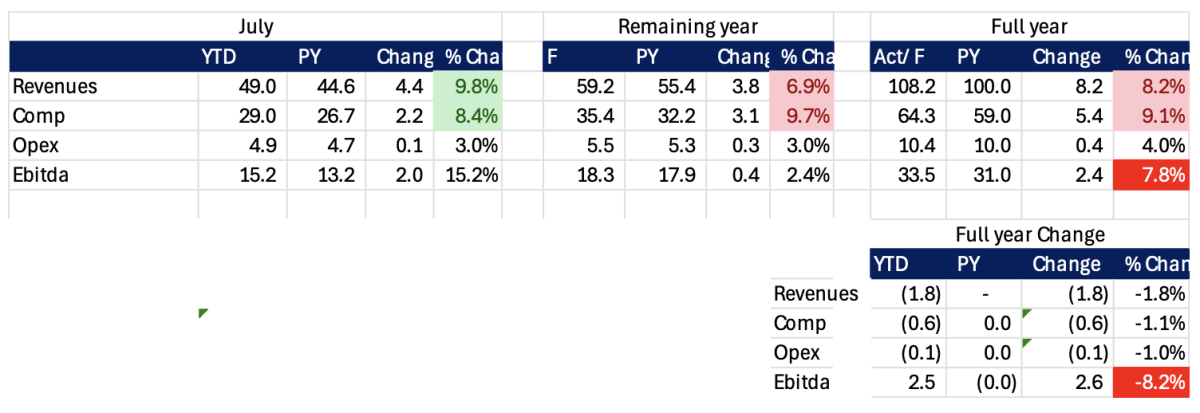
Figure 2. July Full P&L: Impact of Forecast Adjustments
July Full P&L – The impact of pulling back revenue by $1.8 million and putting comp forward by $600k is that revenue growth decreases from 10% to 8.2%, comp growth decreases from 8% to 9.1%, and EBITDA growth decreases from 16.1% to 7.8%.
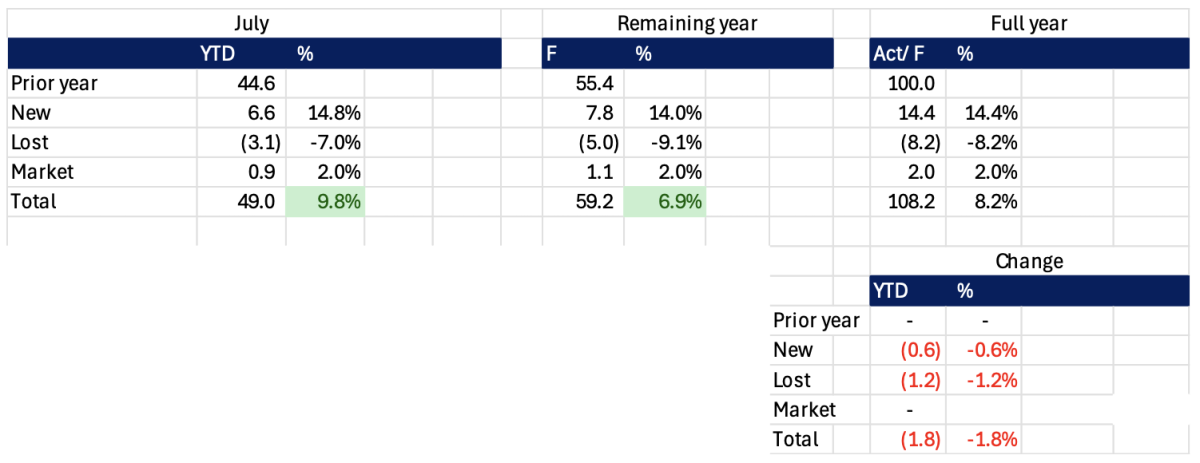
Figure 3. July Revenue Growth: Drivers of the 1.8% Decline
July Revenue Growth – A $600k drop in new business and $1.2 million increase in lost revenue decreases revenue growth 1.8% to 8.2% total. Generally, we would expect to see a corresponding decrease in comp when we pull back revenues, but that’s not in our forecast at this time.
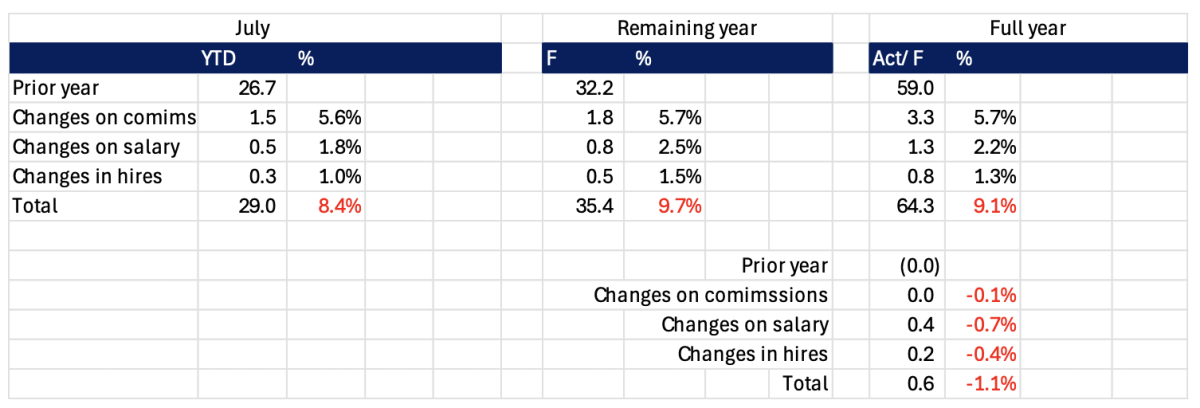
Figure 4. July Compensation Growth: Movement from Quadrant 1 to Quadrant 2
July Compensation Growth – The additional raises and hires increase our compensation by up to 9.1%. Not significantly greater than the 8.0% we previously forecasted, but enough to move us from Quadrant I, where we generate reinvestment dollars for the business, to Quadrant 2, where we are diluting margin and potentially choking reinvestment.
Conclusion
FP&A must evolve beyond traditional reporting to become a strategic partner in driving performance in today's dynamic business environment. By understanding the business model, segmenting revenue and compensation, and applying mental models, we can uncover deeper insights and influence better decisions. Monthly reviews should not just explain the past, they should shape the future. When we consistently focus on fundamentals, filter out the noise, and repeat key metrics, we build a shared performance language across the organisation. Ultimately, our goal is to help leaders see the story behind the numbers and use that story to outperform.
The full text is available for registered users. Please register to view the rest of the article.
Related articles

Why are the KPIs an important component in FP&A? What can organisations do to design and...

FP&A must drive profitable business decisions. As companies increase investments in advanced analytics, CFOs and their...

In this article, the author reveals how FP&A teams can help businesses with forecasts. He reflects...

This article aims to explore the role of FP&A in facilitating decision-making processes, overcoming communication obstacles...

In this article, the author explains how FP&A teams can use the FAIR data management framework...
+
Subscribe to
FP&A Trends Digest
We will regularly update you on the latest trends and developments in FP&A. Take the opportunity to have articles written by finance thought leaders delivered directly to your inbox; watch compelling webinars; connect with like-minded professionals; and become a part of our global community.