
In this article, the author challenges the criticism of dashboards, arguing that they play a critical...

Why Finance Still Gets Surprised: The Case for Financial Observability
June 11, 2026

Finance has more systems, more dashboards, more KPIs, and more reporting tools than ever. Yet finance teams still get surprised too late.
Margins erode faster than expected. Cash tightens abruptly. Control breaks. Customer behaviour changes before anyone notices. Problems continue to be discovered too late: at month-end, during variance review, or when a board member asks a difficult question. In many cases, that is when the investigation begins, and in many organisations, the issue is not the lack of data. It is not even that the reported numbers are wrong. The issue is that finance still lacks early visibility into what is breaking as it starts to break.
That is the gap financial observability is meant to close.
Finance Still Runs on Systems of Record, Not Systems of Awareness
Most finance systems today serve one of the following purposes: they record history, support planning, summarise outcomes, or visualise aggregates. ERP and accounting systems are systems of record. FP&A platforms help to structure performance and planning. Dashboards make results more accessible and visually appealing. All of these are useful. None of them, on their own, create a true control layer over changing financial reality.
A dashboard is not a control layer. A monthly review is not a control layer. Even a strong KPI architecture is not, by itself, a control layer. Too often, month-end becomes a delayed process for error discovery. Delayed discovery is something that finance teams experience over and over again.
That distinction matters because recording history is not the same as maintaining awareness. Most finance systems are designed to tell teams what happened. Very few are designed to continuously surface what is changing underneath the reported aggregated numbers, whether that change is meaningful, and whether there is still time to act before it impacts business performance.
That becomes more important as financial reality grows more distributed. Today, what finance ultimately sees in the statements is shaped across ERP, CRM, billing, payments, banking, payroll, procurement, and other operational systems. The underlying truth is fragmented long before the board reports are assembled.
Observability in Finance Requires a Canonical Financial State
Financial observability starts with a simple architectural idea: finance needs a continuously updated understanding of financial state across systems, not just a better way to read numbers after the fact.
This is not about creating more data. It is about creating a coherent, governed representation of financial reality as it changes. If truth is fragmented underneath, finance will remain late no matter how polished the reporting layer becomes.
That is why financial observability should not be understood as a dashboard category or as an Artificial Intelligence layer on top of existing reports. It begins much deeper. Observability requires a canonical financial state: a common financial understanding of what changed, where it changed, and how those changes relate across the business.
Only then can finance move from retrospective explanation to continuous awareness.
What Matters Is Not Just the Number, But the Behaviour around the Number
Financial observability is often reduced to anomaly detection. I think that misses the point.
The real challenge is not simply to flag unusual values or find outliers. It is to distinguish structural change from noise. In finance, it requires understanding what is normal for that specific business.
Take customer concentration. Revenue can appear stable for months while dependence on a single customer quietly increases underneath. The number still looks fine, but the behaviour has changed: what once looked like diversified revenue is now concentrated risk. By the time that becomes obvious in reported performance, strategic options are already narrower.
A 15% movement can be critical in one context and irrelevant in another. Some metrics are naturally volatile. Some are seasonal. Some appear stable in aggregate, while underlying concentration, cadence, or mix quietly deteriorates. A healthy-looking top line can mask weakening invoicing rhythm, growing dependency on a small group of customers, or declining collection behaviour. A stable cost base can conceal changes in vendor concentration or unit economics.
The same pattern appears elsewhere: margins are often understood after the quarter closes, overpayments are found weeks later, and product-level deterioration may only become visible once cash flow is already under pressure.
This is why a true observability layer must understand baselines and normal behaviour, not just current values. It has to recognise whether a movement is expected, noisy, seasonal, or structurally important. It has to understand direction, stability, cadence, concentration, and materiality. Without that context, finance does not get observability. It gets more noise.
Finance Needs Visibility into Both Business Change and Process Instability
Another reason this category matters is that not all meaningful change in finance is economic.
One class of signals reflects changes in the business itself: customer behaviour weakening, revenue concentration increasing, cash becoming less predictable, DSO creeping upward, vendor costs spiking, or margin pressure emerging before it is fully visible in reported results. These are economic signals. They matter because they affect performance, risk, and optionality.
But another class of signals reflects instability in the process around the books: duplicate payments, late postings, backdated entries, incorrect mappings, excessive reclassifications, unusual posting patterns, forgotten reversals, incorrect provisions, and missed or late invoices, to name just a few. These do not always mean the business itself has changed. They mean the financial process changed in a way that makes the numbers less timely, less reliable, or less trustworthy.
Both of them matter. The business can remain stable while the accounting process deteriorates. The accounting process can remain right while the business weakens underneath. Finance needs visibility into both.
The end vision is cross-system signals, not isolated accounting alerts
The category becomes much more powerful when understood cross-systems, not as an accounting-only layer.
In the long run, financial observability should make it possible to detect cross-system signals such as demand or pipeline quality weakening before revenue is visibly down, invoicing cadence breaking before the income statement shows deterioration, collections slowing while reported growth still looks acceptable, cash behaviour diverging from expected operating patterns, or financial statements changing because of process instability somewhere else in the system chain.
That is what makes this more than anomaly detection. It is a continuous awareness of financial state and reality across systems.
The difference between how finance operates today and how observability changes it can be summarised below:
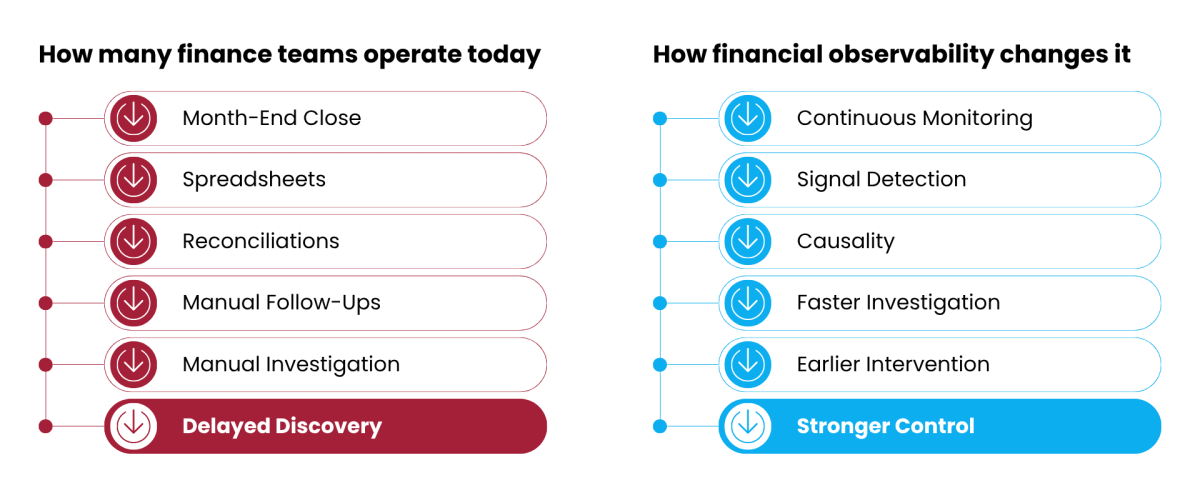
Figure 1. Financial Observability: From Delayed Discovery to Continuous Financial Awareness
What This Means in Practice for FP&A
For FP&A teams, this does not mean replacing every existing system or trying to monitor everything at once. It means adding an earlier awareness layer between close cycles and between raw data and decision-making, so the team is not waiting until month-end to discover that something important has already shifted.
In practice, the first step is to identify a small number of high-consequence signals that tend to change underneath stable-looking aggregates. For many businesses, that means customer concentration, invoicing cadence, collections behaviour, vendor dependency, cash pattern predictability, margin integrity, or posting stability. These are not exotic metrics. They are the patterns that often create the most painful surprises later.
The second step is to establish what normal behaviour actually looks like for the business. Not just what the budget says, and not only what happened last year, but what the usual range, cadence, concentration, and timing patterns look like in practice. Without that context, teams tend to rely on static thresholds that either miss important shifts or generate noise.
The third step is to monitor those behaviours more frequently than the close cycle. Not daily and not across dozens of signals at once, but often enough to catch structural change before the month is over and before the audit reveals them. Weekly is often enough. The goal is not to close the books every week. It is important to notice when something material has started to move, even when response options still exist.
Just as important, none of this works well without a reliable data foundation. Observability depends not only on signal logic, but on coherent definitions, consistent master data, and trustworthy context across systems. If the underlying data is fragmented or ownership is unclear, finance may still get dashboards and alerts, but not decision-grade awareness. That is why the data foundation matters as much as the detection layer itself.
A practical place to start is simple: pick one signal that would matter if it shifted quietly for three weeks, establish its normal range, and track it consistently for a quarter. If it produces a signal, expand. If it produces noise, refine the baseline or choose a different one. The point is not to create more reporting. It is to help FP&A move earlier from detection to interpretation to action.
Why This Matters for the CFO
For finance professionals, the value is straightforward. Fewer surprises. Earlier intervention. Faster root-cause traceability. Less time spent reconstructing why numbers moved after the questions have already started. More confidence in whether a change reflects economic deterioration, timing noise, or process instability.
But most of all, it preserves decision space.
The goal is not constant alarms. It is continuous awareness. Good observability does not create drama. It creates timing. It allows finance to see structural change earlier, respond while options still exist, and operate with greater control over the present rather than just explaining the past.
Finance teams already have systems of record, planning, and reporting. What is still missing is a control layer that maintains continuous awareness of financial state across systems, distinguishes structural change from noise, and makes root cause visible before options disappear.
That is how I think about financial observability. As a category, it is still forming. As a need, it is already here. For FP&A leaders, the practical starting point is simple: strengthen the data foundation, begin with the few signals that most often precede surprise, and build the habit of monitoring behaviour, not just outcomes. The real question for finance leaders is not whether observability becomes infrastructure, but whether they will prepare for it intentionally or discover its absence during the next surprise.
The full text is available for registered users. Please register to view the rest of the article.
Related articles

Strong controllership gives FP&A the reliable actuals, faster close cycles, and clearer business drivers needed to...

In this article, senior leaders from PepsiCo, BILL, and Workday reveal how FP&A teams can turn...

This article explores frameworks for developing FP&A dashboards and tells us how FP&A professionals can design...

The article explores how data-driven FP&A transforms organisations by integrating financial and non-financial metrics to drive...

In this article, you will learn the most common pitfalls in driver-based forecasting and the practical...
+
Subscribe to
FP&A Trends Digest
We will regularly update you on the latest trends and developments in FP&A. Take the opportunity to have articles written by finance thought leaders delivered directly to your inbox; watch compelling webinars; connect with like-minded professionals; and become a part of our global community.