

How AI cost dynamics force FP&A to move from forecasting to decision-ready planning.

Explaining and Forecasting AI Costs: Part 3 of 6
November 19, 2026

In Part Two, I argued that the economically useful unit of AI cost is unlikely to be a token or even necessarily a model call. Depending on the activity, we may instead need to understand the cost of a task, use case, process or acceptable outcome — and the architecture chosen to deliver it becomes part of that cost.
Once we have decided what we are trying to cost, the next Finance question is a familiar one: why did the number move? If AI expenditure increases, we need to distinguish whether that came from doing more work, paying a different rate, changing the mix of models or architecture, or simply performing the same work less efficiently. The same drivers can then become the basis for forecasting what happens next.
Explaining Why the Cost Moved
An increase in AI spend can come from quite different causes. More work may simply have been performed. Provider pricing may have changed. A larger share of requests may have been routed to more expensive models. Average prompt or response length may have increased. Agents may be taking more steps to complete the same task. Cache performance may have deteriorated, or more requests may be failing and being retried. Where dedicated infrastructure is involved, utilisation can also change the effective unit cost.
If you look at it this way, an increase looks less like a mysterious new type of technology spending and more like a conventional variance problem. The terminology may differ, but Finance already has a well-developed habit of separating volume, rate, mix, and efficiency effects rather than treating every movement in expenditure as a single number.
| Driver | What might have changed? |
|---|---|
| Volume | More tasks, users or transactions |
| Rate | Provider or model pricing |
| Model mix | More work is routed to expensive or cheaper models |
| Token intensity | More context or output per task |
| Agent depth | More model calls, tool calls or reasoning steps |
| Cache efficiency | More or less reuse of prompts or context |
| Quality / rework | More retries, failures or human intervention |
| Capacity utilisation | Dedicated or provisioned infrastructure used more or less efficiently |
Table 1. Examples of the main drivers behind changes in AI spend
The exact list will depend on the architecture, and I would not become too attached to the labels. What matters is the principle. A movement in AI spending should be explained in terms of a reasonably small number of operational and technical drivers, rather than remaining a single undifferentiated number.
This difference matters because the management response depends on the cause. A higher bill caused by stronger adoption of a successful use case may be perfectly healthy. The same increase caused by unnecessary frontier-model usage, repeated failed agent loops or poorly utilised dedicated capacity suggests something quite different.
The variance itself is still only the start of the investigation. If token intensity has increased, for example, Finance would still want to understand why. Maybe tasks became more complex, retrieved documents became longer, prompts expanded, or the mix of activity changed. Giving the variance a name isn’t the point - tracing it far enough back to something that can actually be managed is.
I think Finance can add considerable value here, not by turning FP&A teams into AI engineers, but by making the technical drivers of cost visible enough that the right questions can be asked.
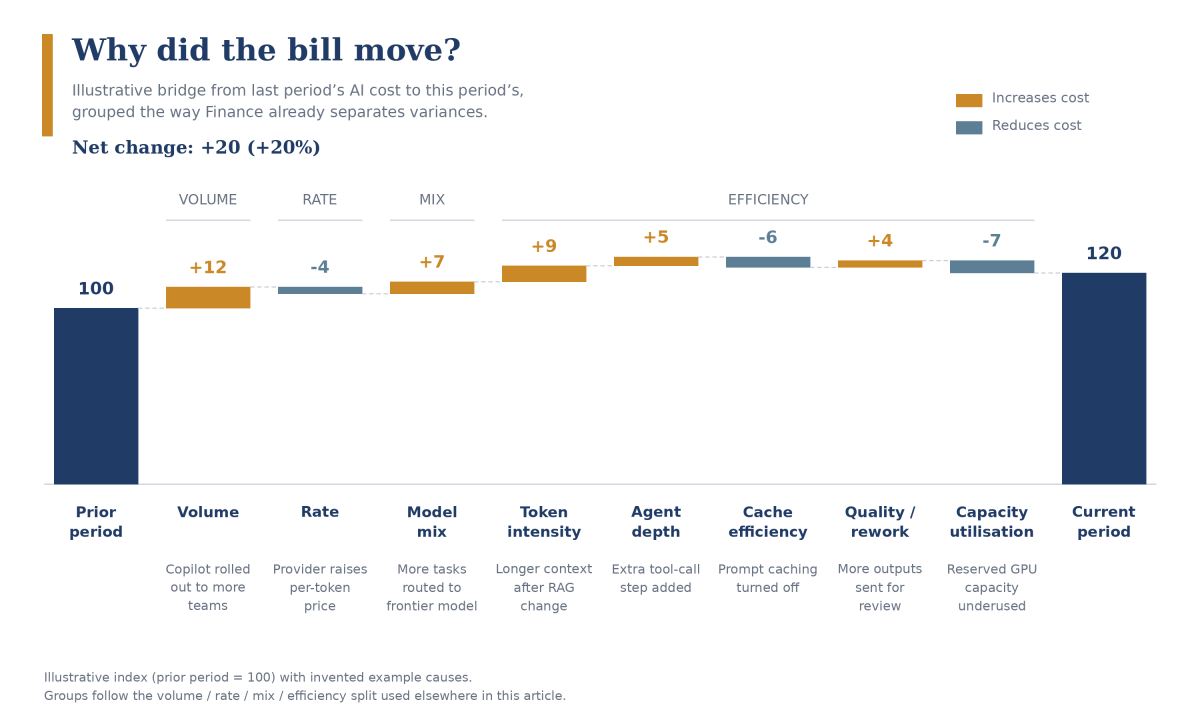
Figure 1. Why did the bill move? An illustrative cost bridge, grouped by volume, rate, mix and efficiency — the same split Finance already uses for variances.
From Explaining the Bill to Forecasting It
Once the main cost drivers are visible, the same logic can start to improve forecasting. Rather than extrapolating AI expenditure from the previous month or applying a generic growth assumption, Finance can begin to model the things that are actually expected to change: how many tasks will be performed, which models are likely to handle them, how much context they will consume, how many steps an agent might take, how much can be cached, and how efficiently any dedicated capacity will be used.
None of this requires pretending we can forecast AI costs precisely. Prices are moving, models themselves are improving quickly, and the architecture that looks sensible today may be replaced surprisingly soon. But those uncertainties are easier to discuss when they are expressed as drivers rather than buried inside a single cost forecast.
A forecast can then become a set of scenarios. Usage might double while better routing shifts more work towards smaller models; model prices may fall while agents demand more steps; dedicated capacity might reduce the cost of each additional task but leave some capacity unused. These are recognisable FP&A questions. The subject matter is new, but the habit of separating volume, mix, rate and efficiency assumptions is not.
The same framework can also help with benchmarking. An exploratory use case may change substantially before it reaches production, so comparison against the original business case alone can become awkward. More stable measures - cost per completed task, cost per acceptable outcome, human intervention, latency, rework or cost-to-serve - can preserve useful comparability with earlier versions, alternative architectures, other vendors or the process being replaced.
The benchmark does not always have to be financial. In some cases, the relevant comparison may be reliability, turnaround time, resilience or the amount of specialist human effort required. The point is to retain enough consistency in the information that management can compare alternatives even while the technology continues to move.
The Harder Part May Be the Wiring
If the objective is to understand AI costs properly, collecting technical data may not be the hardest part. Modern platforms can already tell us a great deal about model calls, tokens, latency, routing, retries, caching and other aspects of an AI workflow.
The harder question is how that information connects to the way the business is actually managed. A technical trace does not automatically know which business process it supported, which product or use case it belongs to, who owns the expenditure, whether the task was completed successfully or what operational outcome followed.
Multiple vendors and deployment models make this harder. One provider may charge by tokens, another through reserved capacity, while an internally hosted model creates infrastructure and support costs elsewhere. The supplier view remains important for reconciling expenditure, but it is not necessarily a useful basis for comparing the economics of the work being performed.
There is a temptation at this point to solve the problem through allocation: collect all the costs and spread them across business units, users or applications using whatever driver is readily available. That may be necessary for accounting purposes, but it can create a longer-term problem. Once a cost has been placed somewhere convenient, it is surprisingly difficult to move it later to a more meaningful place.
More importantly, arbitrary allocation can detach cost from its actual drivers. A business unit may receive a charge that it cannot meaningfully influence, while the architectural decisions that determine the cost lie elsewhere. When management later asks why expenditure is increasing, the accounting view can tell us where the cost landed without explaining what caused it.
For AI, that distinction is particularly important because many of the drivers are potentially observable. Model choice, task volume, token intensity, agent depth, caching, retries and utilisation can all influence the economics. The opportunity is therefore to keep those causal links intact instead of losing them too early through broad allocation rules.
Finance now needs to decide where this information should actually live.
The full text is available for registered users. Please register to view the rest of the article.
Related articles

The article is not only about AI cost. It argues that FP&A gatekeeping, business-case approval, cost...
Driver-Based Forecasting in FP&A: Common Pitfalls and Practical Solutions
In this article, we explore how driver-based forecasting differs from consolidation, why it enables more meaningful...

Why FP&A should measure AI investment through predictive value, governance, and strategic impact rather than headcount...

AI ROI in corporate finance depends less on smarter models than on trusted data, mature processes...

In this article, the author explores how FP&A professionals can champion Change Management to break down...
+
Subscribe to
FP&A Trends Digest

We will regularly update you on the latest trends and developments in FP&A. Take the opportunity to have articles written by finance thought leaders delivered directly to your inbox; watch compelling webinars; connect with like-minded professionals; and become a part of our global community.