
Even if last six years I have been specialized in Data management, I still follow (thanks...

Presenting FP&A Strategy’s Data Maturity Model to Accelerate your Finance transformation
May 15, 2017
 It’s the middle of the year, and it’s time to take charge of your “data destiny” before the budgeting and planning season starts. What exactly is your data destiny? No, it’s not the new Netrunner card game where the objective is to control all the data in the Universe.
It’s an understanding of how you can leverage all your internal and external financial and operational data to give you a strategic advantage. Relevant data is the key to understanding it all, but too often, this is disbursed throughout your organisation.
In 2017, Globally, 39% of all CFO’s was pursuing a significant upgrade in their company’s information, data, and communications systems (1). This trend is real, and I’m already seeing companies moving swiftly to take advantage of new BI trends and hire more data-centric talent into their Finance teams. More than a “trend”, it’s a “shift”.
Why is this Tectonic Shift in Data happening Now?
- Data quality issues - Multiple data sources require manual aggregation & consolidation, which are prone to error resulting in a debate about the accuracy of the number and not the insight
- Timing to insight - Low frequency and the length of time it takes to receive the insight limits the ability of stakeholders to take early corrective actions
- Data is offline – adjustments and data manipulation are done in offline Excel spreadsheets, usually by one person, and no one else knows how it’s done
- Data hoarders – Data is power, and if no one else has it, it makes one important
TAKE CONTROL
Your Data Maturity model
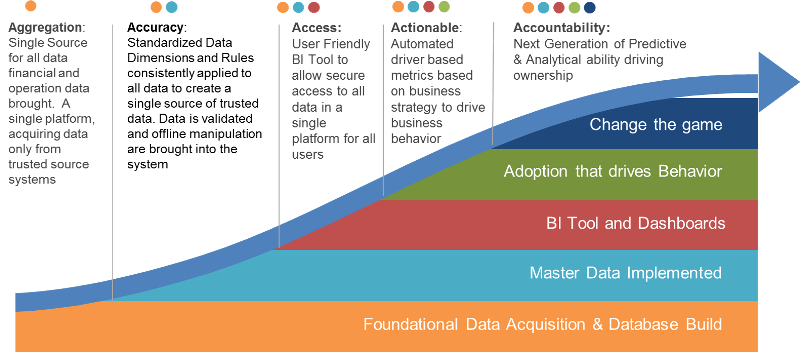
FP&A’s data maturity model is a step-by-step process to help you move along the value/maturity curve until you achieve your ultimate goal of game-changing data analytics.
Step 1: Aggregation = Single source
Having all your data in one place is the first significant step toward data nirvana. This often requires a lot of IT heavy lifting, but it doesn’t have to be. There is new technology out there that will help, but my advice is to start small. Find the most critical data and focus on that – run through all the steps before onboarding the next data set. This will enable you to prove out the solution and demonstrate the value quickly – Once you start adding value, it will be easier to find more investment.
Step 2: Accuracy = Strong executive support
This step is all about agreeing on terminology and rules. This part heavily relies on all the stakeholders agreeing to a single naming convention, methodology and taxonomy – it’s all about standardisation. This can be one of the most challenging tasks in mature large companies as it often requires change management. To ensure this part succeeds, you will need to have strong executive support. You will also need to validate your data and bring offline logic into the system. Accuracy is vital as there is nothing worse than spending more time debating numbers as opposed to their meaning. You will need everyone to buy into the idea that your single source of data is the only source otherwise, you will fail in the following steps.
Step 3: Access = Mastering dashboards
This is typically the easiest because of the development of powerful BI tools. Still, unless there is strong governance, it can easily get out of hand (see Mastering Dashboards to Build Value). Good dashboards are designed to drive strategic initiatives into the company and to ensure users can identify issues quickly and know what corrective actions to take. Try to avoid dashboard design that results in: confusion; groups are competing against each over or more common just being ignored. Security is key at this stage – making sure that the right users have access to the right data at the right time.
Step 4: Actionable = Think!
Building dashboards that keep us informed are interesting but don’t add a whole lot of value. Take revenue, for example – this is a typical metric you will see on any dashboard, e.g. how much have we booked to date; how are we performing to targets or year over year growth. What we really want is to drive actions into the organisation. The best way to do that is to focus on the underlying drivers of revenue, e.g. what is your pipeline conversion rate, what pipeline coverage do you have, or what is the impact of your marketing promotions.
Step 5: Accountability = Support
The key to driving insight is starting with the business problem. Too often, I see people bombarding their stakeholders with data, normally in the form of 70 page PowerPoint decks with detailed tables and 11pt type. That only alienates. Take a step back and take the time to understand your stakeholders and what’s really important to them. Spend time understanding the drivers behind this and create dashboards that give your stakeholders key insights that help them identify the outcome of their actions. You’ll know when this support is working when they return and ask for more.
YOU HAVE A DATE WITH DESTINY
This is the time for data leadership. Discerning and communicating it in a meaningful way to the organisation is literally the most important job you will ever do! Use FP&A’s Data Maturity Model to accelerate your FP&A transformation. The time to get ahead of this is right now.
Footnotes:
1. THE CFO ALLIANCE - 2017 CFO SENTIMENT STUDY: 39% of respondents reported they would be pursuing a significant upgrade in their company’s information, data, and communications systems in 2017, up from 29% in 2016
The full text is available for registered users. Please register to view the rest of the article.
Related articles

We live in a modern, technological world where data, or more accurately insights from data, can...

Analytics runs all business, yet it’s so often obfuscated. To make it real is a journey...

To create value from data, you do need a big data strategy – right? Well, actually...

Data management is a business function that, in my opinion, every company should have. Still, often...
+
Subscribe to
FP&A Trends Digest
We will regularly update you on the latest trends and developments in FP&A. Take the opportunity to have articles written by finance thought leaders delivered directly to your inbox; watch compelling webinars; connect with like-minded professionals; and become a part of our global community.