SWTCH by Pigment
Three days of predictions, insights, and advice from leaders in finance, sales, HR, supply chain and more
Register now here

SWTCH by Pigment
Three days of predictions, insights, and advice from leaders in finance, sales, HR, supply chain and more
Register now here
 This article applies to all private sector firms, not just Mergers and Acquisitions (M&A) and Private Equity (PE) firms. The technique described here can also be used to rank the profitability of five financial planning alternatives to the traditional budget:
This is the seventh article in the series devoted to the wide variety of benefits provided to the firm by the next generation budget, the Operational Budget (OB), and its associated Operational Income statement (OIS). The first six articles were:
This article has five sections including i) importance of advanced analytics for all firms including M&A and PE; ii) two advanced analytics currently used by M&A and PE firms: iii) how the OB integrates these two analytics; iv) how the OB determines how much profit last year’s results left on the table and v) conclusion.
According to the FP&A Trends’ Advanced Analytics Model (see figure 1 below) both the current M&A/PE advanced analytics’ applications discussed in section (ii) are utilizing the most advanced stage of analytics, prescriptive modeling.
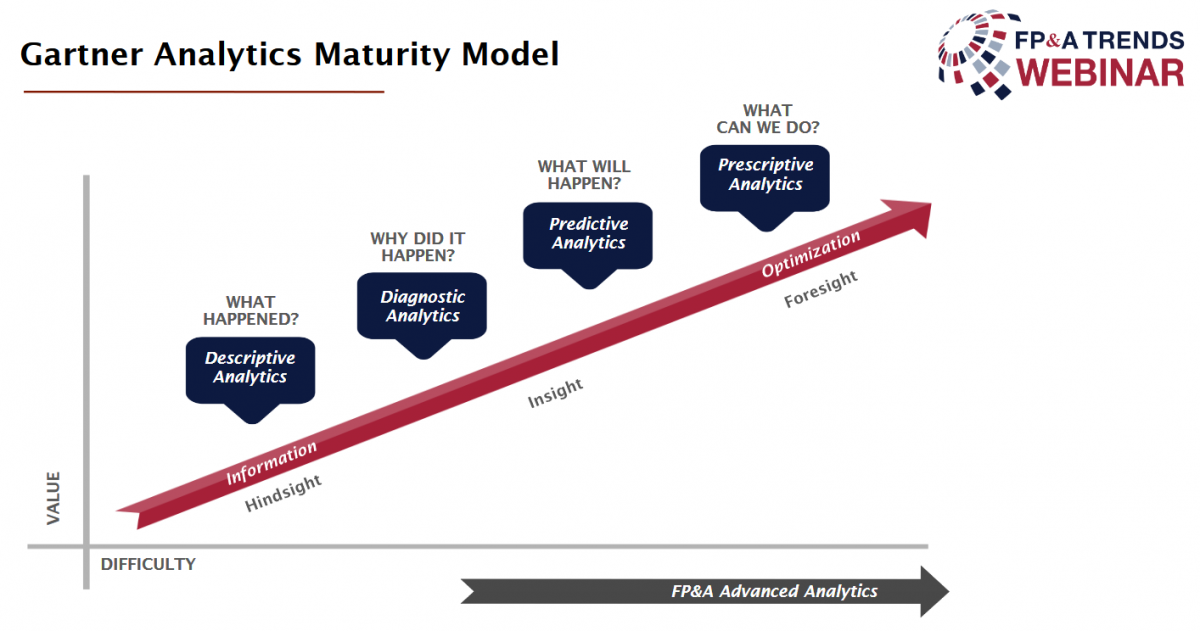
Figure 1. Gartner Analytics Maturity Model
A variety of trade press articles and white papers have made a strong case for the use of advanced analytics. Examples include (bold added):
1. A white paper from the International Institute of Analytics titled “Analytics Maturity Powers Company Performance” concluded “Companies with high analytics maturity are more likely to
2. An August 16, 2016 article in the CFO Magazine “Finance Must Ramp Up Role as Analytics Leader” by Tom Davenport. Below, paraphrased, are his most important comments apropos this article:
3. A recent Gartner article titled: “Make Way for Advanced Financial Analytics” commented that:
4. A Gartner research titled “Prescriptive software, worldwide, 2019” commented that ”… 11% of mid and large-sized enterprises currently have some form of prescriptive analytics. This will grow to 37% by 2022”.
Two of the advanced analytic applications in use by M&A and PE firms today that are relevant to this article are both prescriptive techniques. These analytics determine what is the best possible outcome, X. These analytics are much more powerful than predictive analytics which describe what the outcome would be if X happens. They are:
The result is that today’s results are necessarily suboptimal i.e. they are neither created for the entire firm nor simultaneously.
The Operational Budget (OB) model starts with the supply chain network design model. These models are created for a year in the future by which time the supply chain redesign being considered could be implemented; typically between 2 to 5 years. The following changes are required to create the OB model:
The result of this integration is that that the OB results are applicable to the entire firm and created simultaneously.
Given the promise of next generation budgeting, it is important to know how easily the OB’s value proposition for any given firm can very be determined. Specifically, how much profit did last year’s p/l leave on the table?
The first step in creating an OB model is to create a baseline model of last year's p/l results. This baseline model ensures the OIS model has structural integrity, typically modeling last year’s results to within 1-2%.
Then, all that's required are the following three steps to update the baseline model:
1. Response functions added to the baseline model. These functions describe how volume varies as a function of sales and marketing expenditures. They serve the purpose of relaxing the assumption in the base line model of a fixed forecast.
2. Capacities and constraints are introduced to the base line model: Where possible, all capacity constraints must be relaxed since there is no way of determining what the new forecast’s volumes will be. Further, when there is more than one option (e.g., second shift, outsource, build ahead, over time), they all should be included so the best one can be chosen. Capacity examples include:
Also, all constraints must be honored. Examples include:
The OB is then run and the results are a new superior income statement. It includes the new most profitable forecast and the associated supply chain required to make and fulfill it. The difference between the profit of the new income statement and last year’s actual profit is the profit that was left on the table.
This article describes how two prescriptive advanced analytical applications in use today, when combined, can show how any firm including M&A and PE firms can determine the amount of profit last year’s results left on the table. This analysis serves as a compelling "proof of concept" of the OIS’s value proposition.
The final article in this series will be how the Operational Budget when combined with today’s zero based budgeting techniques create next generational zero based planning functionality.

You don’t have to go far to read something about a failed Merges and Acquisitions (M&A)...

The article is titled Mergers & Executions. It’s not a typo. You might think it should...

In this article, we will look at how driver-based advanced analytics has overcome the problems with...
We will regularly update you on the latest trends and developments in FP&A. Take the opportunity to have articles written by finance thought leaders delivered directly to your inbox; watch compelling webinars; connect with like-minded professionals; and become a part of our global community.